How to Read Crypto Price Charts
- Understanding the basics of crypto price charts
- Analyzing different types of crypto price charts
- Identifying key indicators on crypto price charts
- Using technical analysis to interpret crypto price charts
- Common mistakes to avoid when reading crypto price charts
- Tips for improving your skills in reading crypto price charts
Understanding the basics of crypto price charts
When it comes to understanding the basics of crypto price charts, it is essential to familiarize yourself with the key components that make up these charts. By gaining a solid grasp of these elements, you will be better equipped to interpret and analyze the price movements of various cryptocurrencies.
One of the fundamental aspects of crypto price charts is the candlestick chart, which provides a visual representation of price movements over a specific period. Each candlestick typically represents a certain timeframe, such as one hour, one day, or one week. The body of the candlestick indicates the opening and closing prices, while the wicks or shadows show the highest and lowest prices reached during that period.
Another crucial element to consider is the volume indicator, which reflects the amount of trading activity for a particular cryptocurrency. High volume often indicates strong market interest and can be a sign of potential price movements. Conversely, low volume may suggest a lack of interest or uncertainty among traders.
Additionally, it is essential to pay attention to support and resistance levels on a crypto price chart. Support levels represent price points where a cryptocurrency tends to find buying interest, preventing it from falling further. On the other hand, resistance levels indicate price points where selling pressure typically emerges, preventing the price from rising higher.
Analyzing different types of crypto price charts
When analyzing different types of crypto price charts, it is important to understand the various formats that are commonly used in the cryptocurrency market. By familiarizing yourself with these different types of charts, you can gain valuable insights into the price movements of various cryptocurrencies.
One of the most common types of crypto price charts is the line chart. This type of chart provides a simple and easy-to-read representation of price movements over a specific period of time. Line charts are useful for identifying trends and patterns in the price data of a particular cryptocurrency.
Another popular type of crypto price chart is the candlestick chart. Candlestick charts provide more detailed information compared to line charts, as they display the opening, closing, high, and low prices for a given time period. This type of chart is especially useful for traders who want to analyze price movements more closely.
Lastly, bar charts are another type of crypto price chart that is commonly used by traders. Bar charts display price movements in a series of vertical bars, with each bar representing a specific time period. Bar charts are useful for comparing price data across different time frames.
By understanding the different types of crypto price charts and how to read them, you can make more informed decisions when trading cryptocurrencies. Whether you prefer line charts, candlestick charts, or bar charts, each type of chart offers unique insights into the price movements of various cryptocurrencies.
Identifying key indicators on crypto price charts
One of the most crucial aspects of reading crypto price charts is identifying key indicators that can help you make informed decisions about your investments. These indicators are essential tools that can provide valuable insights into the market trends and potential price movements of cryptocurrencies.
When analyzing crypto price charts, it is important to pay attention to key indicators such as moving averages, relative strength index (RSI), and volume. Moving averages can help you identify trends by smoothing out price fluctuations over a specific period. The RSI is a momentum oscillator that measures the speed and change of price movements, indicating whether a cryptocurrency is overbought or oversold. Volume is another critical indicator that shows the level of activity in the market, helping you gauge the strength of a price movement.
By understanding and interpreting these key indicators on crypto price charts, you can gain a better understanding of market dynamics and make more informed decisions about when to buy or sell cryptocurrencies. It is essential to use these indicators in conjunction with other analysis tools to get a comprehensive view of the market and avoid making impulsive decisions based on price movements alone.
Using technical analysis to interpret crypto price charts
When it comes to interpreting crypto price charts, technical analysis plays a crucial role in understanding market trends and making informed trading decisions. By analyzing historical price data and volume, traders can identify patterns and trends that may indicate potential future price movements.
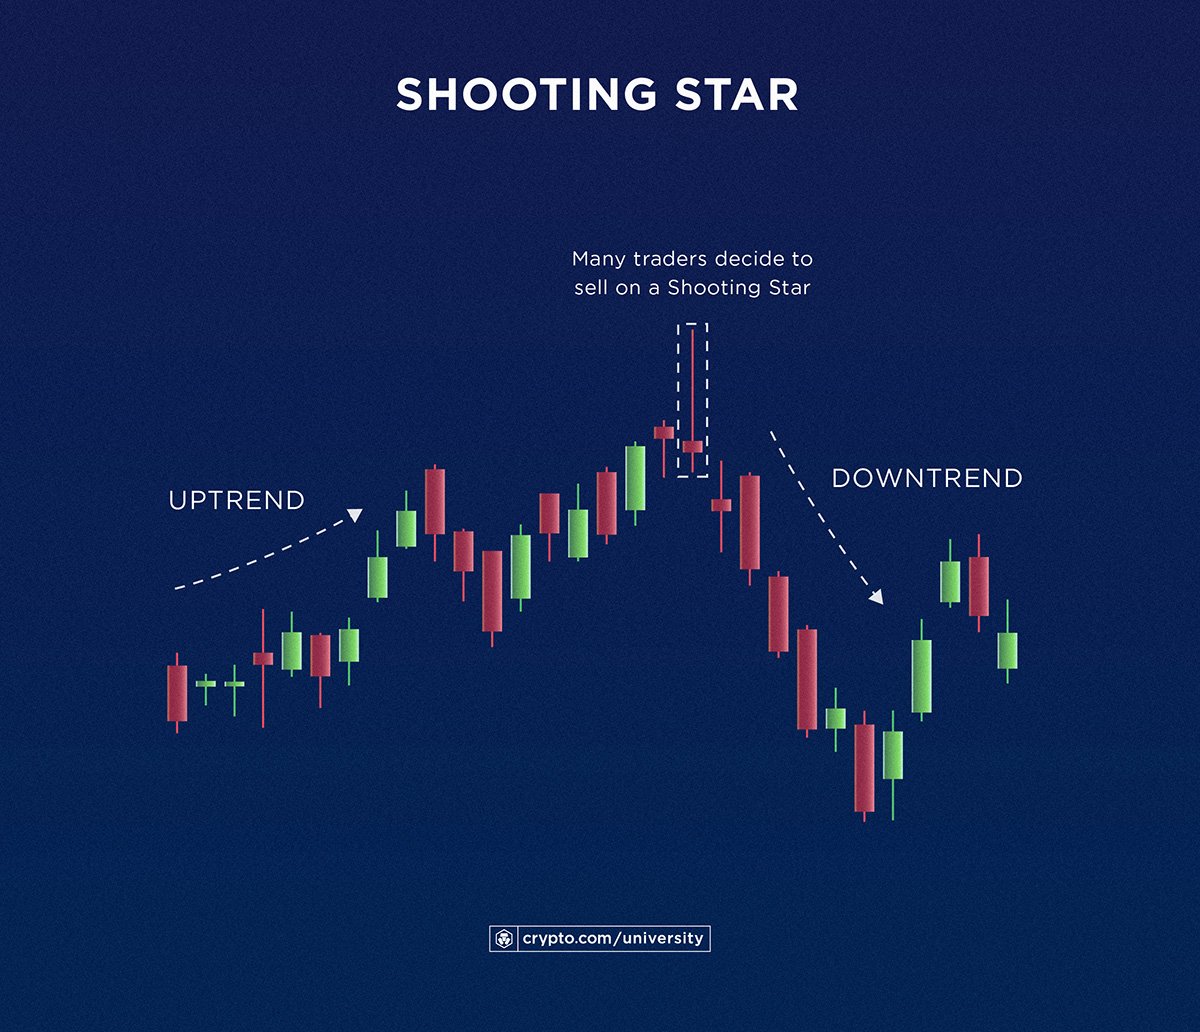
One of the key tools used in technical analysis is chart patterns, which are formations that appear on price charts and can signal whether an asset is likely to move up, down, or sideways. Some common chart patterns include head and shoulders, double tops and bottoms, triangles, and flags.
Another important aspect of technical analysis is the use of indicators, which are mathematical calculations based on price and volume data. Indicators can help traders confirm trends, identify overbought or oversold conditions, and generate buy or sell signals. Some popular indicators used in crypto trading include moving averages, relative strength index (RSI), and MACD.
It’s essential for traders to combine chart patterns, indicators, and other technical analysis tools to get a comprehensive view of the market. By using these tools together, traders can increase their chances of making successful trades and managing risk effectively in the volatile crypto market.
Common mistakes to avoid when reading crypto price charts
When reading crypto price charts, there are several common mistakes that traders should avoid to make informed decisions. These mistakes can lead to misinterpretation of data and ultimately result in financial losses. It is important to be aware of these pitfalls and take steps to avoid them.
- Overtrading: One common mistake is overtrading based on short-term price fluctuations. It is essential to focus on the long-term trend rather than getting caught up in the daily ups and downs of the market.
- Ignoring volume: Another mistake is ignoring trading volume, which can provide valuable insights into market sentiment. High volume often indicates strong interest in a particular asset, while low volume may signal a lack of interest or potential price manipulation.
- Not using multiple timeframes: Traders should not rely solely on one timeframe when analyzing price charts. It is important to consider multiple timeframes to get a comprehensive view of the market and identify trends more accurately.
- Confirmation bias: Traders should be cautious of confirmation bias, which is the tendency to interpret information in a way that confirms preconceptions. It is essential to remain objective and consider all possible outcomes when analyzing price charts.
- Not setting stop-loss orders: Failing to set stop-loss orders is a common mistake that can result in significant losses. Traders should always have a risk management strategy in place to protect their investments.
By being aware of these common mistakes and taking steps to avoid them, traders can improve their ability to interpret crypto price charts accurately and make more informed trading decisions. It is essential to approach chart analysis with a critical mindset and consider all relevant factors to achieve success in the volatile cryptocurrency market.
Tips for improving your skills in reading crypto price charts
Improving your skills in reading crypto price charts is essential for successful trading in the cryptocurrency market. Here are some tips to help you enhance your abilities:
- 1. **Understand** the basics: Before diving into analyzing crypto price charts, make sure you have a solid understanding of the fundamentals of technical analysis.
- 2. **Identify** key patterns: Look for common patterns such as support and resistance levels, trend lines, and chart formations to help predict future price movements.
- 3. **Use** multiple timeframes: Analyzing price charts across different timeframes can provide a more comprehensive view of the market and help you make better-informed decisions.
- 4. **Utilize** technical indicators: Incorporating technical indicators like moving averages, RSI, and MACD can help you confirm trends and identify potential entry and exit points.
- 5. **Practice** regularly: The more you practice reading crypto price charts, the better you will become at interpreting them accurately and quickly.
By following these tips and continuously honing your skills, you can improve your ability to read crypto price charts effectively and make more informed trading decisions in the volatile cryptocurrency market.