How to Use Technical Analysis for Crypto Trading

- Understanding the basics of technical analysis
- Key technical indicators for crypto trading
- Implementing support and resistance levels in your analysis
- Using moving averages to identify trends
- Utilizing chart patterns for better trading decisions
- Combining technical analysis with fundamental analysis for a comprehensive approach
Understanding the basics of technical analysis
Technical analysis is a method used by traders to evaluate investments and identify trading opportunities by analyzing statistical trends gathered from trading activity, such as price movement and volume. By understanding the basics of technical analysis, traders can make more informed decisions when trading cryptocurrencies.
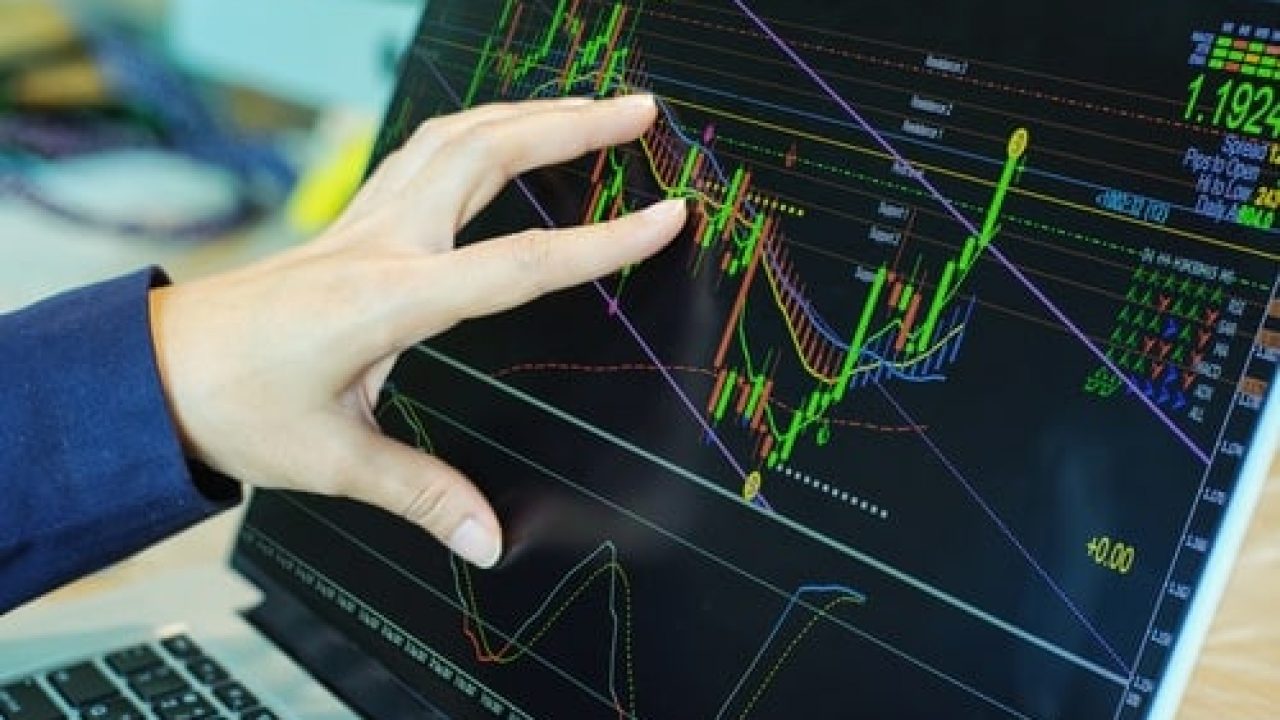
One fundamental concept in technical analysis is the use of charts to visualize historical price data. These charts can help traders identify patterns and trends that may indicate potential future price movements. Common types of charts used in technical analysis include line charts, bar charts, and candlestick charts.
Another key aspect of technical analysis is the use of indicators. Indicators are mathematical calculations based on price, volume, or open interest that can help traders predict future price movements. Some popular indicators used in technical analysis include moving averages, relative strength index (RSI), and Bollinger Bands.
It is essential for traders to understand that technical analysis is not a foolproof method for predicting the future price of cryptocurrencies. While it can provide valuable insights, it is essential to consider other factors, such as market news and events, when making trading decisions. Additionally, it is crucial to use technical analysis in conjunction with other forms of analysis, such as fundamental analysis, to get a more comprehensive view of the market.
Key technical indicators for crypto trading
When it comes to crypto trading, there are several key technical indicators that traders use to make informed decisions. These indicators help traders analyze price trends, market volatility, and potential entry and exit points. Here are some of the most commonly used technical indicators in crypto trading:
- Relative Strength Index (RSI): The RSI is a momentum oscillator that measures the speed and change of price movements. It ranges from 0 to 100 and is used to identify overbought or oversold conditions in the market.
- Moving Averages: Moving averages are used to smooth out price data and identify trends over a specific period of time. Traders often use the 50-day and 200-day moving averages to determine the overall trend of a crypto asset.
- Bollinger Bands: Bollinger Bands consist of a middle band (simple moving average) and two outer bands (standard deviations away from the SMA). They are used to measure volatility and identify potential reversal points in the market.
- MACD (Moving Average Convergence Divergence): The MACD is a trend-following momentum indicator that shows the relationship between two moving averages of an asset’s price. Traders use the MACD to identify changes in the strength, direction, momentum, and duration of a trend.
- Fibonacci Retracement: Fibonacci retracement levels are horizontal lines that indicate where support and resistance are likely to occur. Traders use these levels to identify potential entry and exit points based on the crypto asset’s price movements.
By understanding and utilizing these technical indicators effectively, crypto traders can make more informed decisions and improve their overall trading strategy. It’s important to remember that technical analysis is just one tool in a trader’s toolbox and should be used in conjunction with other forms of analysis and risk management strategies.
Implementing support and resistance levels in your analysis
Support and resistance levels are crucial aspects of technical analysis when it comes to trading cryptocurrencies. These levels help traders identify potential entry and exit points for their trades. By implementing support and resistance levels in your analysis, you can make more informed decisions and improve your overall trading strategy.
Support levels are price levels where a cryptocurrency tends to find buying interest, preventing it from falling further. On the other hand, resistance levels are price levels where a cryptocurrency tends to encounter selling pressure, preventing it from rising higher. By identifying these levels on a price chart, you can anticipate how the price of a cryptocurrency may behave in the future.
To implement support and resistance levels in your analysis, you can use various technical indicators such as moving averages, trendlines, and Fibonacci retracement levels. These tools can help you identify key levels where the price of a cryptocurrency is likely to reverse or continue its current trend. By paying attention to these levels, you can set your stop-loss orders, take-profit targets, and determine the overall risk-reward ratio of your trades.
In conclusion, incorporating support and resistance levels into your technical analysis can significantly enhance your trading performance in the cryptocurrency market. By understanding how these levels work and using them effectively in your analysis, you can make more informed trading decisions and increase your chances of success. So, make sure to pay attention to support and resistance levels in your analysis to improve your trading strategy.
Using moving averages to identify trends
One popular method in technical analysis for crypto trading is using moving averages to identify trends. Moving averages help traders smooth out price data to identify the direction of a trend over a specific period of time. By analyzing moving averages, traders can gain insights into whether an asset’s price is trending upwards, downwards, or moving sideways.
There are different types of moving averages that traders can use, such as the simple moving average (SMA) and the exponential moving average (EMA). The SMA gives equal weight to all data points over the specified period, while the EMA gives more weight to recent data points. Traders can choose the type of moving average that best suits their trading strategy and time horizon.
When using moving averages to identify trends in crypto trading, traders typically look for crossovers between different moving averages. For example, a bullish crossover occurs when a short-term moving average crosses above a long-term moving average, indicating a potential uptrend. Conversely, a bearish crossover occurs when a short-term moving average crosses below a long-term moving average, signaling a potential downtrend.
Utilizing chart patterns for better trading decisions
When it comes to crypto trading, utilizing chart patterns can be a valuable tool for making better trading decisions. Chart patterns are visual representations of price movements that can help traders identify potential trends and market reversals. By recognizing these patterns, traders can make more informed decisions about when to buy or sell cryptocurrencies.
Some common chart patterns that traders use include head and shoulders, double tops and bottoms, triangles, and flags. Each of these patterns can provide valuable insights into the market and help traders anticipate future price movements. For example, a head and shoulders pattern may indicate a potential trend reversal, while a triangle pattern could suggest a period of consolidation before a breakout.
By learning how to identify and interpret these chart patterns, traders can gain a better understanding of market dynamics and improve their overall trading strategy. It’s important to remember that chart patterns are not foolproof indicators and should be used in conjunction with other technical analysis tools and fundamental analysis. However, when used correctly, chart patterns can be a powerful tool for making more informed trading decisions in the crypto market.
Combining technical analysis with fundamental analysis for a comprehensive approach
Combining technical analysis with fundamental analysis can provide a more comprehensive approach to crypto trading. While technical analysis focuses on historical price data and chart patterns, fundamental analysis looks at the underlying factors that can affect the value of a cryptocurrency.
By using both types of analysis together, traders can gain a more well-rounded view of the market and make more informed decisions. For example, technical analysis can help identify entry and exit points based on price trends, while fundamental analysis can provide insight into the long-term potential of a crypto asset.
When combining technical and fundamental analysis, it’s important to consider how each type of analysis complements the other. For instance, if technical analysis indicates a strong buy signal for a particular cryptocurrency, but fundamental analysis reveals concerning news about the project behind the coin, it may be wise to reconsider the trade.
Ultimately, using a combination of technical and fundamental analysis can help traders navigate the complex and volatile world of crypto trading more effectively. By leveraging the strengths of both approaches, traders can make more informed decisions and potentially improve their overall trading performance.


